
Call history and logs
The Call history screen lists every call Live Hub has handled, newest first, with its final outcome. Open a call to see the complete picture: who participated, how the bot performed, what was said, the recording, the underlying SIP exchange, and how the call ended.
View call history
The Call history tab lists calls newest first. The search box, the date range, and the filters narrow the list to the calls you are interested in.
To view your call history:
-
In the Navigation pane, select Calls.
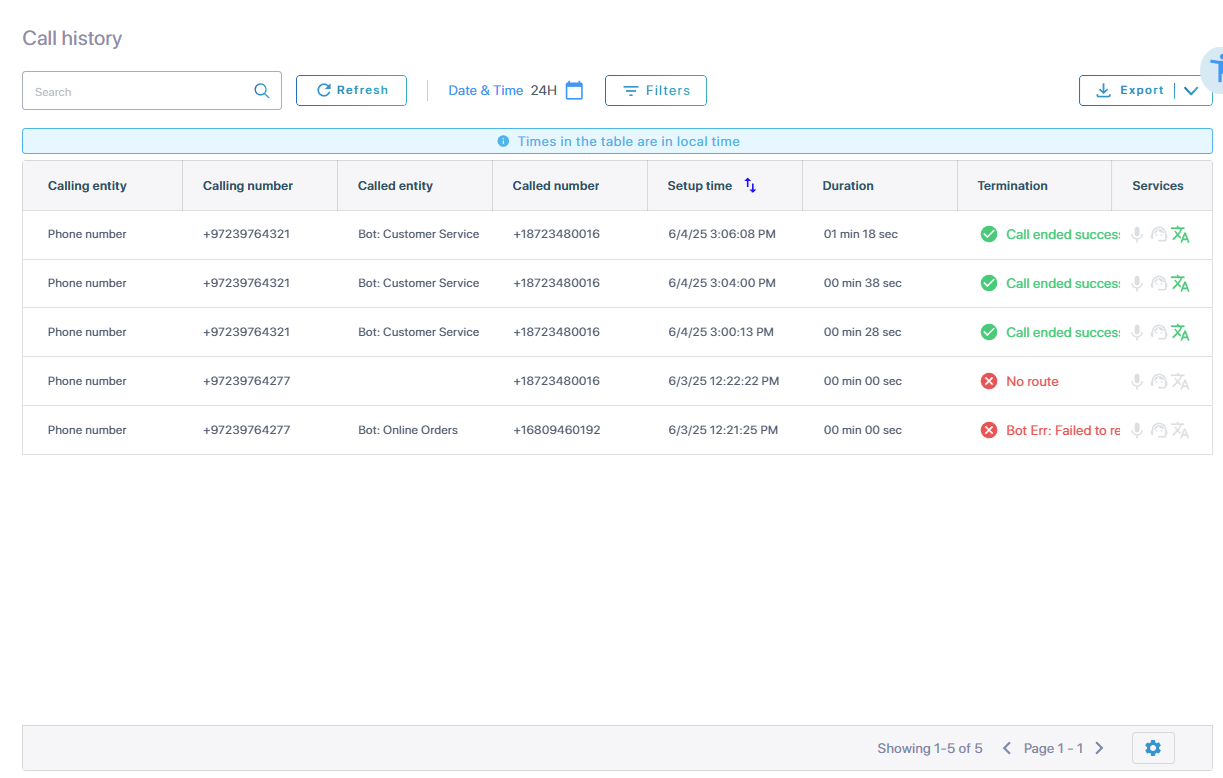
The Call history tab opens by default.
-
In the search box, enter text to find specific calls. Search covers a period of up to 3 days.
-
Click Date & time to set the period, and then:
- Select 24 Hours, 7 Days, 30 Days, or Custom, and then select the dates on the calendar.
- Optional: Under Time range, narrow it to a time of day.
- Click Apply.
-
Click Filters to show only records containing specific values.

- From the 'Columns' drop-down list, select the column you want to test.
- From the 'Operator' drop-down list, select how to test it.
- In the 'Value' field, enter what to test it against.
-
Click Add filter for a further condition, and then select And or Or to specify how the two combine. To clear the filters again, click Remove all.
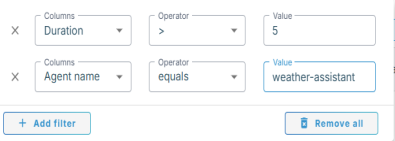
With no filters enabled, records appear in 'Setup time' order.
-
Click Refresh to reload the table.
The table shows times in your local time zone. Exported files use UTC.
Customize table display
The table settings control which columns appear, how tightly the rows are packed, and whether they are striped.
To change the columns, density, or striping:
-
At the bottom right of the screen, click the table settings
 icon.
icon.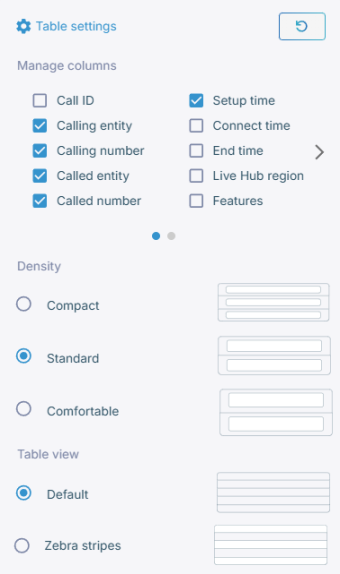
- Under 'Manage columns', select which columns to show. Beyond the defaults, you can add the call ID, connect and end times, voice quality, bot conversation ID, campaign name and ID, tag, features, and insights.
- Under 'Density', select how tightly the rows are packed: Compact, Standard, or Comfortable.
- Under 'Table view', select Default or Zebra stripes.
-
Click Reset settings to put the columns back as they were.
Export call history
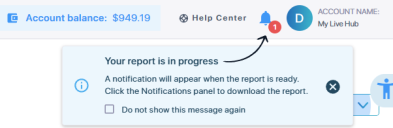
Download your call history for your records or analysis. Exporting is a background job: Live Hub builds the file and tells you when it is ready.
To export your call history:
-
Click Export, and then select Export records to export the calls currently in view, with your filters applied.
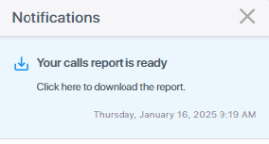
A notification appears stating the download status.
-
Click the notifications panel to download the report.
'Setup time', 'Connect time', and 'End time' in the file are UTC.
-
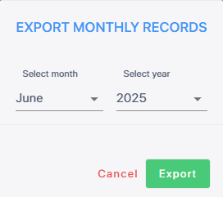
To download a whole calendar month instead, regardless of the filters, click Export, and then select Export monthly records.
-
Select the month and year, and then click Export.
Analyze a call in detail
Select a call in the table to view all of its information. The pane that opens covers when the call ran and how it ended, who was on each end, how quickly the bot answered, the audio and the text of the conversation, the SIP messages behind it, the voice quality, and every field Live Hub recorded.
Which sections appear depends on the call. The pane can show:
- Call actions
- Call summary
- Bot latency
- Call recording
- Call transcripts and logs
- SIP ladder
- Voice quality
- Call details
- Metrics
Call actions
Select the call, and then click the ellipsis button in the upper-right corner of the pane. What it offers depends on the call and on your permissions:
| Action | What it does |
|---|---|
| Download call details | Saves this one call as calls_report.csv: the parties, times, duration, completion status, MOS values, campaign, and tag. Times are UTC. |
| Delete call details | Removes the record. Live Hub warns you first: the record is deleted after 60 days. |
| Search for related call records | Finds the other legs of the same conversation. |
| View billing details | Shows what the call cost. Available only if you have permission to see billing; if the call was free, Live Hub reports that instead of opening the breakdown. |
Live Hub supports the alternative route feature, where records that share a session ID are transfer calls or calls that took an alternative route. Search for related call records brings them together.
Call summary
The top of the pane identifies the call and its two ends.
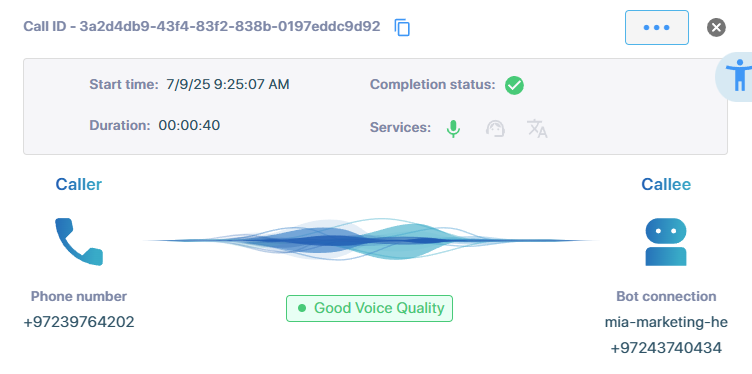
The header carries the call ID, with a copy icon beside it. Below the header, the pane shows these fields:
- 'Start time'
- 'Duration'
- 'Completion status'
- 'Services' — the features that ran on the call, such as recording or voice translation
Beneath these fields, the pane shows the two participants, 'Caller' and 'Callee'. Each one identifies what it is, such as a phone number, a bot connection, a SIP connection, Teams, WhatsApp, or Click-to-call, and gives its number. Between them, the pane rates the voice quality, for instance Good Voice Quality.
Bot latency
The Bot latency section breaks down the delays that occurred during the call, so you can see whether a slow reply came from speech recognition, the bot, or speech synthesis. Hover over the bar to view the latency details.
- STT latency — the time between the end of the caller's spoken input and receiving the final recognition result from speech-to-text.
- Bot latency — the time between sending a request to the bot and receiving the response.
-
TTS latency — the time between accessing text-to-speech and getting the spoken response.

The graph shows only the latency types that are relevant and available for the call.
Call recording
The Call recording section plays a saved recording of the call. The player provides a waveform and the usual controls: play and pause, stop, skip back or forward 10 seconds, and volume.
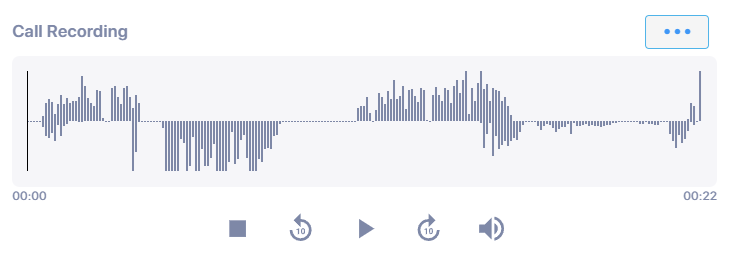
Where a call produced several recordings, a 'Select recording' drop-down lists them by number and time span. Select one, and it loads into the player.
Click the ellipsis button beside Call Recording, and then select one of the following:
- Download call recording: Saves the recording you are playing.
- Delete call recording: Removes the recording, after a confirmation. When the call has several, this reads Delete call recordings and removes all of them.
Where there is no player, the message explains why:
| Message | Meaning |
|---|---|
| The call was not recorded | Recording was not enabled for this call. The message links to how to enable it. |
| The recording is still being processed | The call ended seconds ago. Wait and reopen it. |
| The recording is no longer available | It was deleted, or its retention period has passed. |
Recording is switched on per bot connection or per routing rule.
Call transcripts and logs
The Call transcripts and logs section displays the text of the call and lets you download it. Which transcripts are available depends on what the call used:
| Transcript | What it holds |
|---|---|
| Simple | The dialog between the parties. |
| Enhanced | The dialog plus the control, system, and raw bot messages behind it. |
| Real time translation | The original and its translation, for a call that ran voice translation. |
| Agent assist bot | The assist bot's side of the call. |
| AI agent log | The reasoning trail of an AI agent: what it heard, which tools it called, and what it answered. |
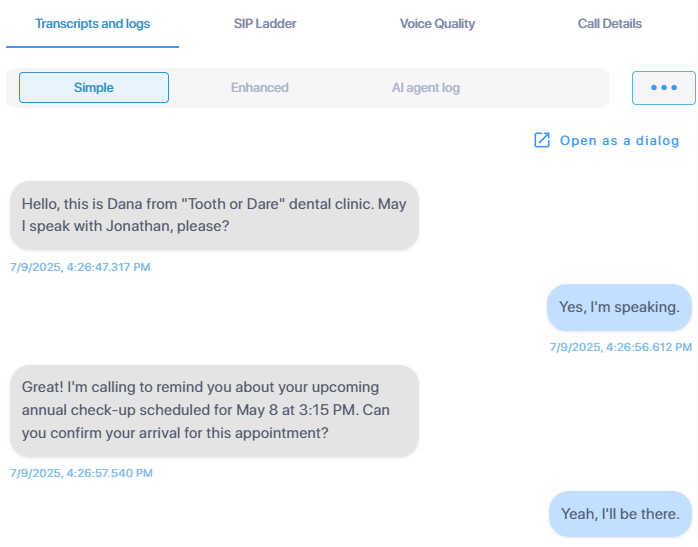
Open as a dialog opens the transcript full width, which is easier on a long call.
To download or delete a transcript:
-
Select the transcript you want.
-
Click the ellipsis button beside the transcript names.
-
Select the download entry for that transcript: Download simple transcript, Download enhanced transcript, Download voice translation transcript, Download assist bot transcript, or Download AI agent log. The matching delete entries sit beside them.
The download is a .json file named after the call:
Simple Call Transcript-{globalSessionId}.json for a simple transcript,
Call Transcript-{globalSessionId}.json for an enhanced one, and
Call Conversation {botConversationId}.json for an AI agent log. For what is inside,
see Call transcript.
A call with no transcript reports "The call transcript is not available": either the transcript was never made, or it has been deleted.
Transcription is switched on per bot connection. Live Hub deletes recordings and transcripts automatically once the account's retention period expires. See Recording and transcripts. Both can also be fetched through the API: see Recordings and Transcripts.
SIP ladder
The SIP ladder section presents the SIP flow diagram of the selected call, showing the SIP messages sent and received in calls that include SIP or Teams participants.
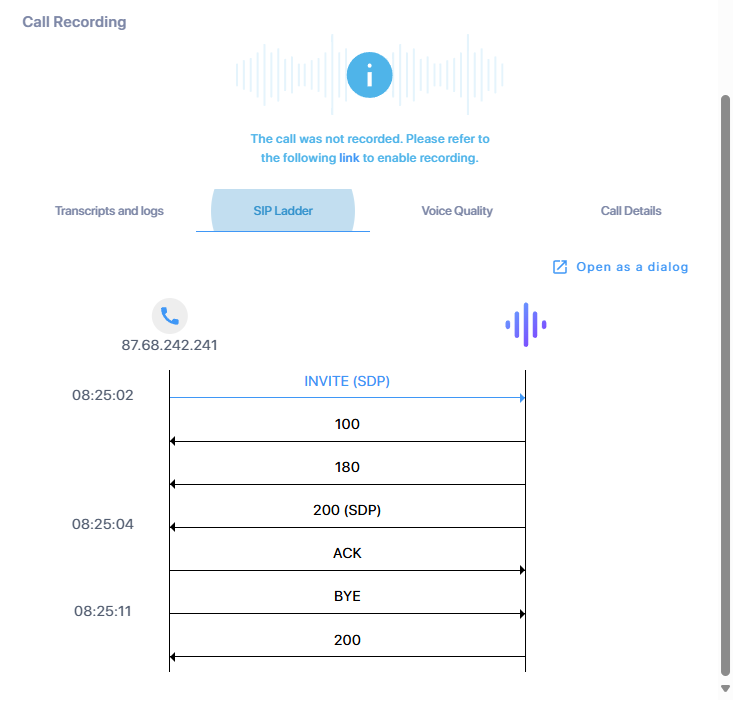
To view a specific SIP message, such as a SIP 180 response, click the message line in the 'SIP Call Ladder' pane, and then click Open as a dialog.
The message then appears in the 'Message details' pane, which has two areas: 'Message info', with the timestamp and call direction, and 'SIP message', with the actual message and its headers.
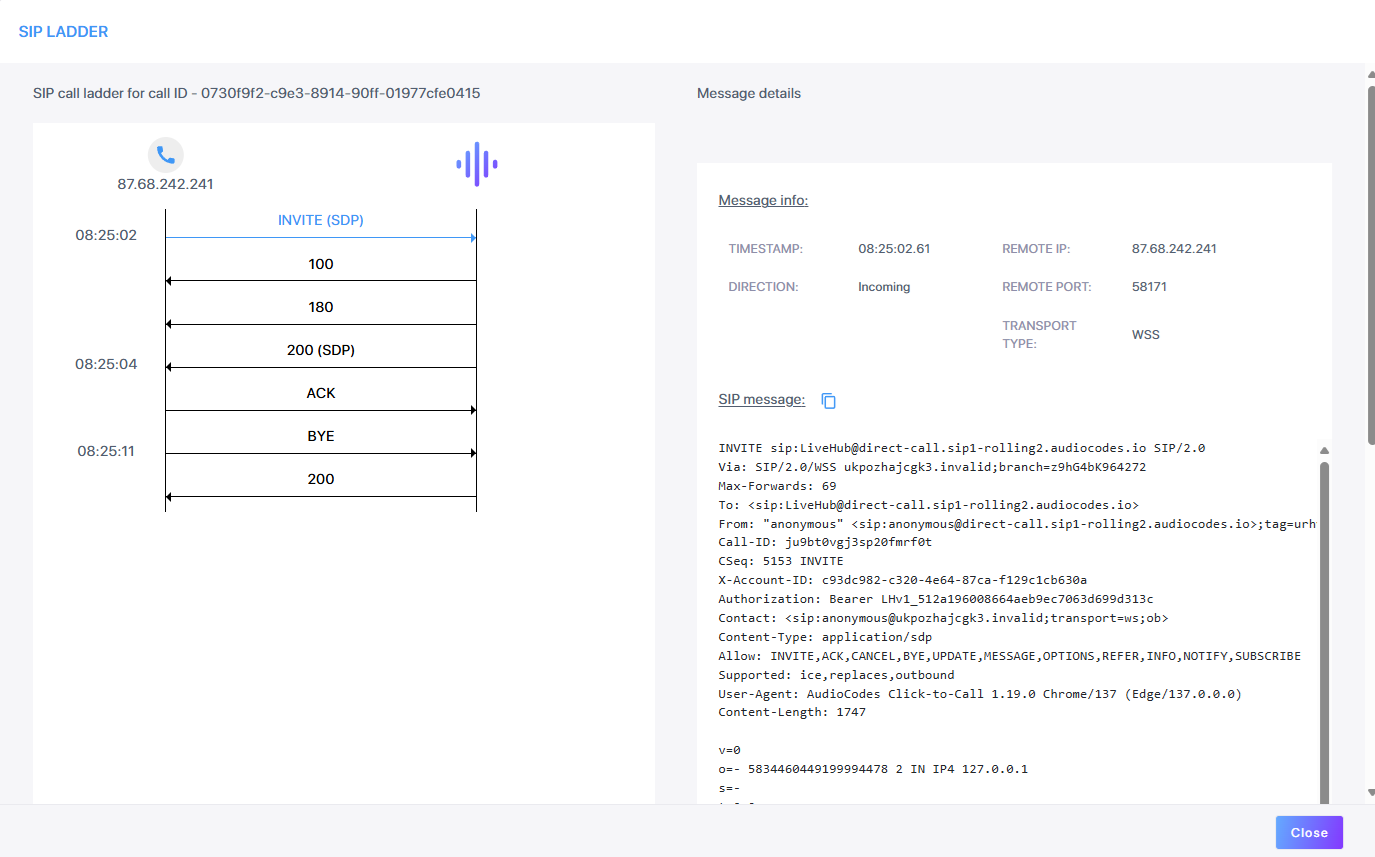
The SIP ladder supports calls that include Microsoft Teams and behave like regular SIP calls.
For the same thing through the API, see SIP ladder (call flow).
Voice quality
The Voice quality section reports the Mean Opinion Score (MOS) for the call, a numerical rating of voice quality on a scale of 1 to 5, where 1 indicates poor quality and 5 represents excellent quality. Live Hub interprets the values as Good, Fair, Poor, or Unknown. Hover over the text for a diagram of the actual MOS values in each direction.
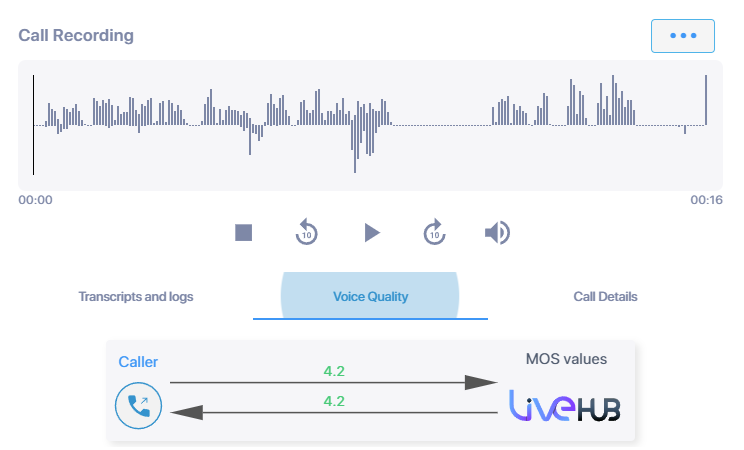
A call with nothing measured reports "MOS values: no information."
Call details
The Call details section gathers detailed information about both the calling and called parties, the features used during the call, and the insights that help explain how and why the call ended:
- Live Hub recording or voice translation
- Termination side — who disconnected the call
- Termination phase — at which stage the disconnection occurred
- Alert duration — whether the call alerted the destination device and for how long
- Tag — if a tag is configured on the routing rule, it appears here
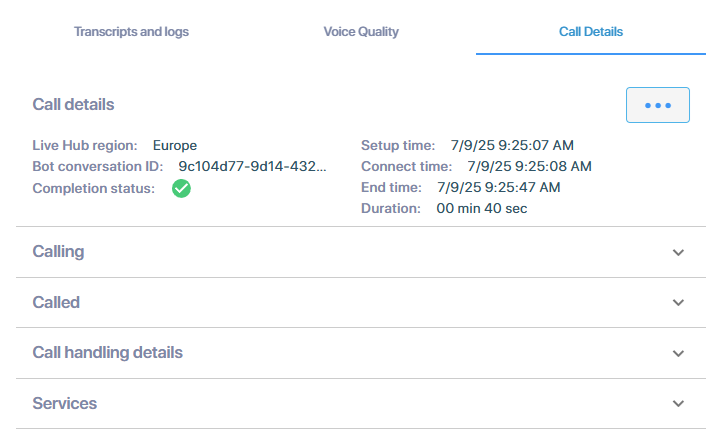
The rest is grouped into sections you expand as needed: the call itself, with its region and times; the Calling and Called parties; the speech providers and models used; the services that ran; and the campaign it belonged to.
For more details, see Call detail fields description.
Metrics
Metrics collected during calls are also available in call history, letting you investigate metric values at the individual call level.
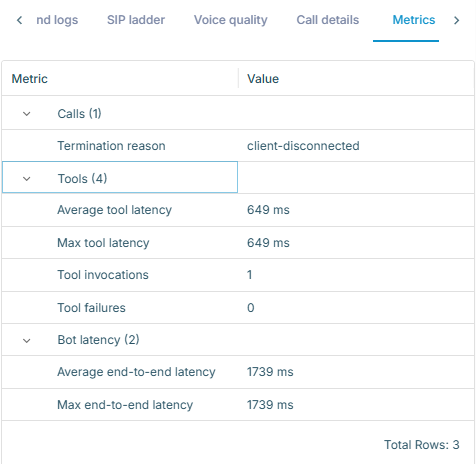
Predefined metrics can appear as dedicated columns in the table, so that you can identify the calls worth opening, while custom Insights metrics are shown separately. The Metrics tab of a call gathers both in one place. See Metrics.